SANS Group | SANS Instruments | SANS Team | Science | Sample Environment | Data Analysis
Install Mantid Workbench
Download from: https://download.mantidproject.org/
O. Arnold, et al., Mantid—Data analysis and visualization package for
neutron scattering and μSR experiments, Nuclear Instruments and Methods
in Physics Research Section A, 764 (2014) 156-166, http://dx.doi.org/10.1016/j.nima.2014.07.029
Part IV:
Merge small and wide angle scattering

Two SANS beamlines, LOQ and SANS2D, can operate using both small and wide angle scattering detectors, as shown in the schematics above. We use the following nomenclature for these detectors:
SANS2D
| LOQ |
| Front and Rear detector | Main and High Angle Bank (HAB) detector |
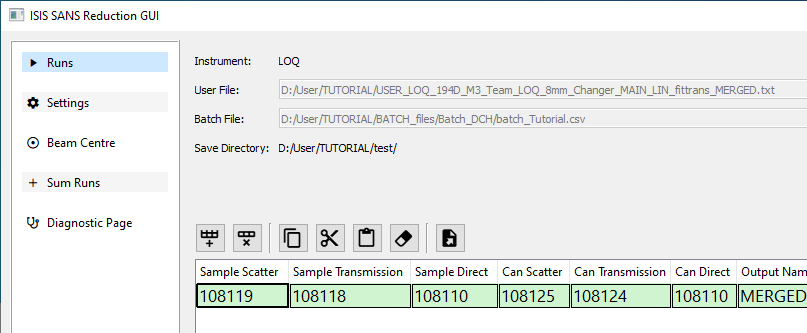
We can easily MERGE the two sets of data (small and wide angle scattering) during REDUCTION DATA process. For "merging" there are two options: first, more recommended, you can use a different User File, prepared by your local contact, which will have the sufix "_MERGED" as in the example below (check "Part I" to remember how to upload the User File to reduce data).
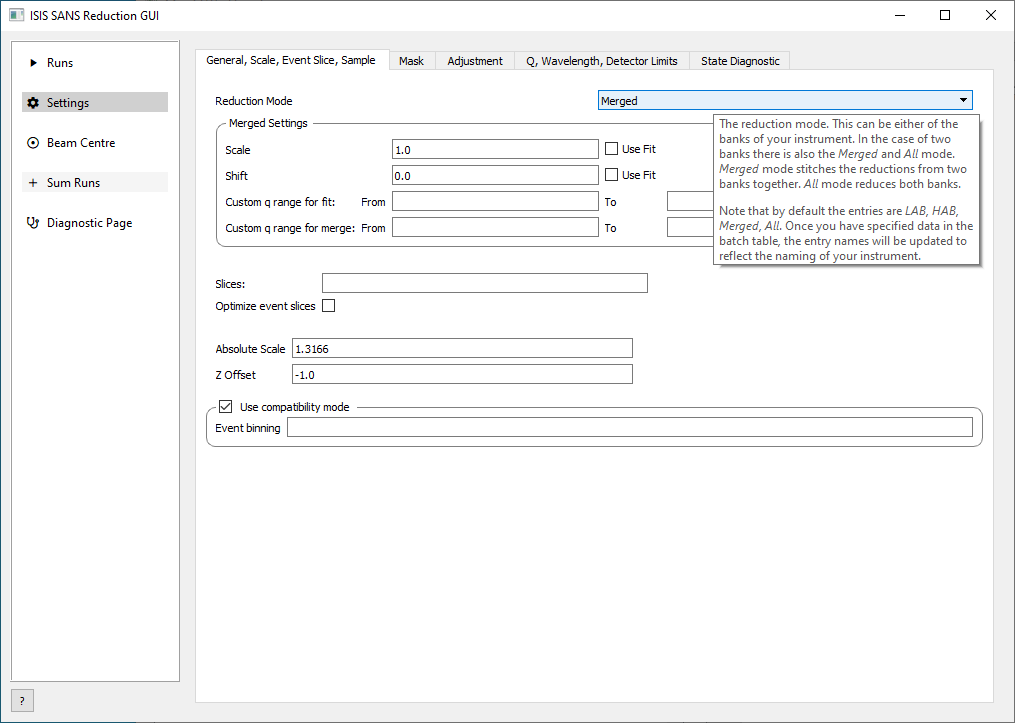
The other option is to make it manually setting all the parameters of the SANS Reduction GUI, as in the picture below:
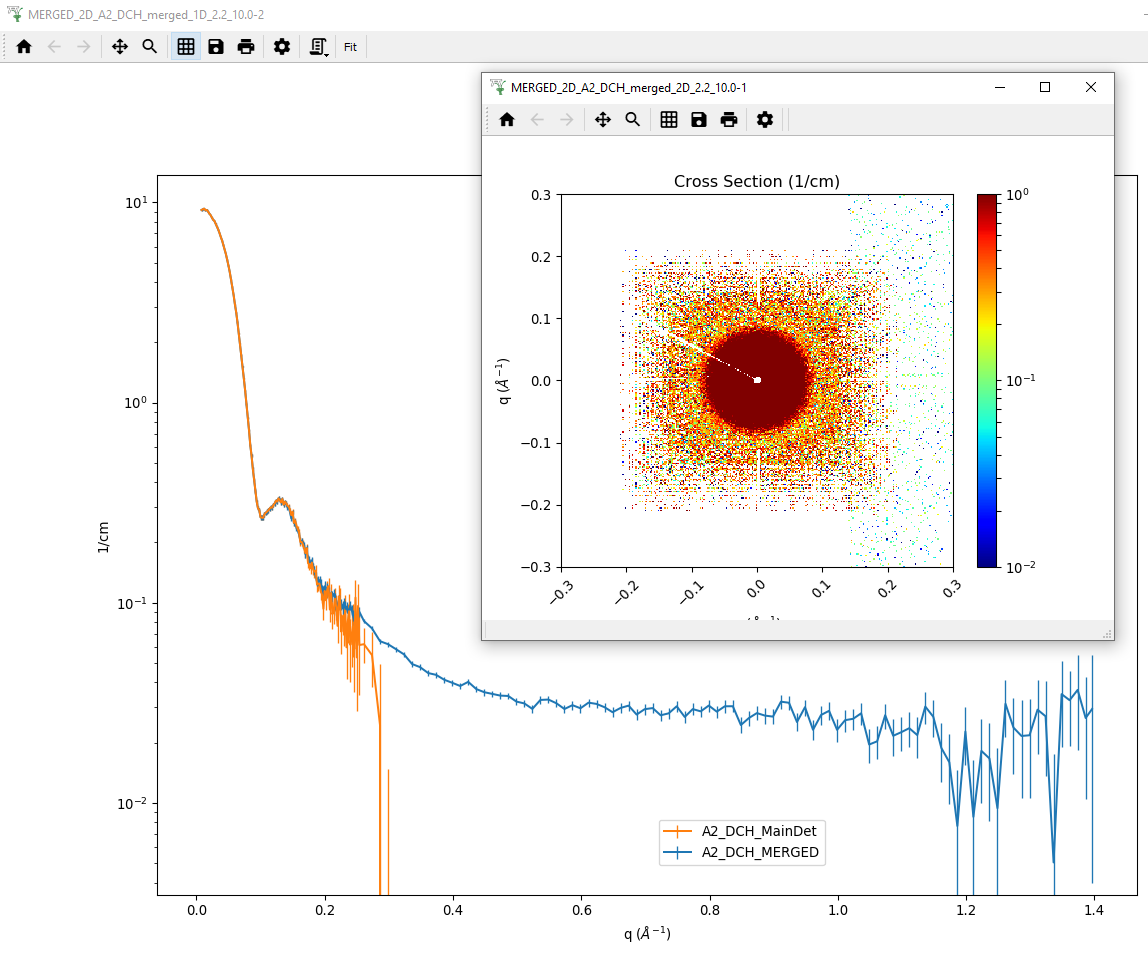
The picture below show an example of the two sets of data already MERGED (the blue curve) compared with the Main Detector (small angle). The reduction process will fit and adjust a scale between the two curves and will also disregard few points on the border of the detector for a perfect "stitching" between small and wide angle.
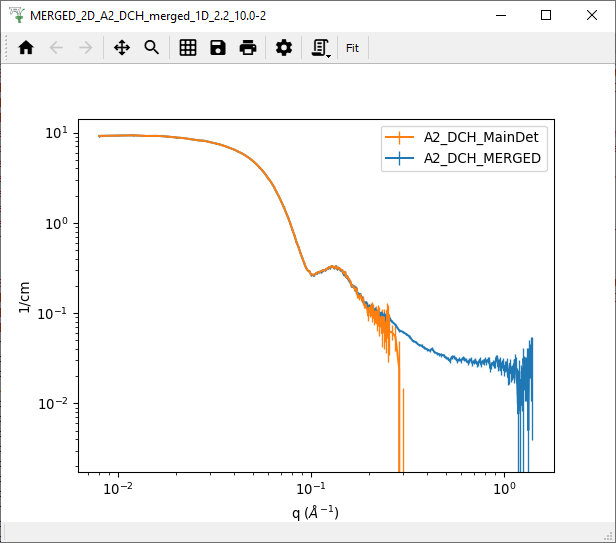
After the Reduction process, the SANS Reduction GUI will show the parameters used on the "stitching". This will be useful in the case you want to make the same process of MERGING for the 2D scattering image.
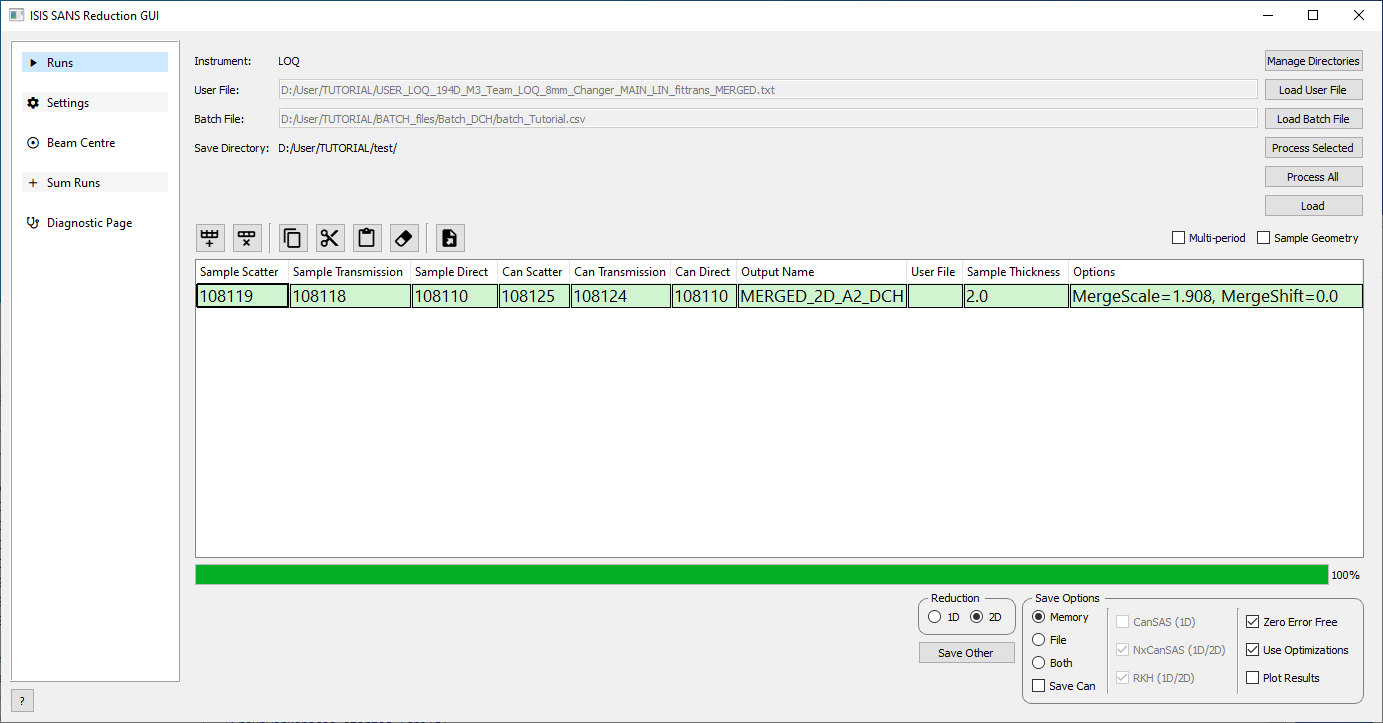
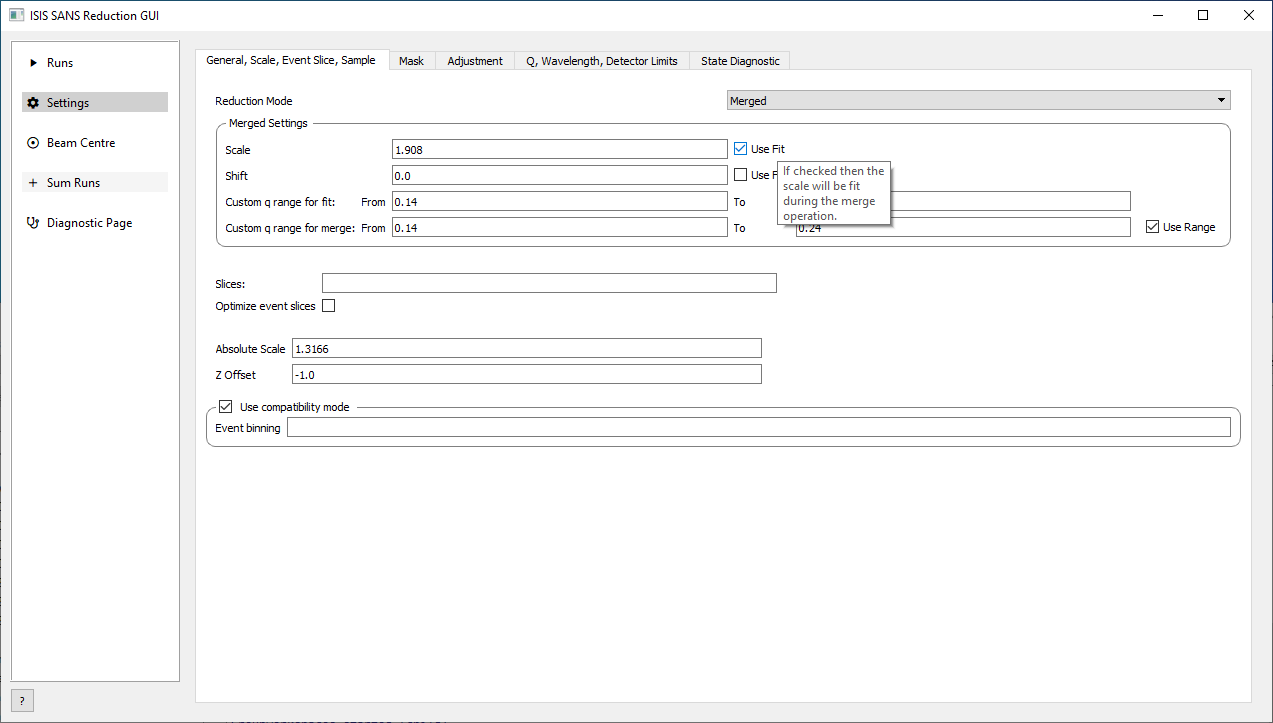
In such a case, write the values "MergeScale" and "MergeShift" that you see from the picture above (in this example, these values are 1.908 and 0.0), into the window that you see in the picture below. Then, UNCHECK THE BOX "USE FIT", come back to the "Runs" window (picture above), choose Reduction 2D and your prefferred "Save Options" (check here to remember about "Save Options").
In the Workbench main window, you can make a graph of your 2D image after reduction and merging process choosing Plot > Colorfill:
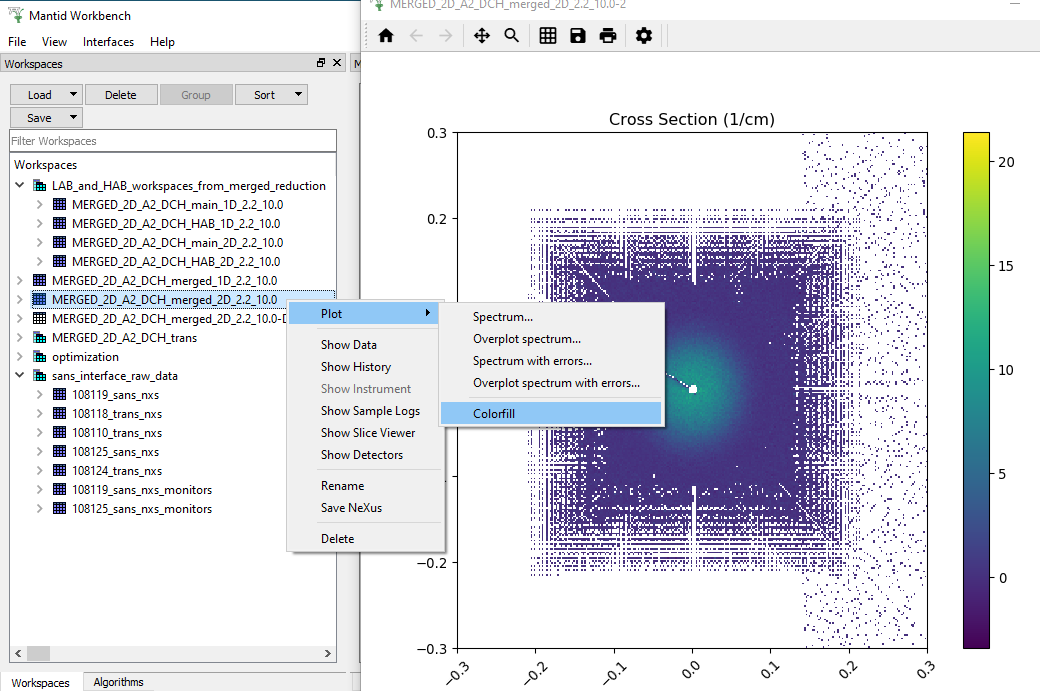
Using the "cog wheel", you can change the colors and other options of the graph.
Run a Python Script
examples...