The first step of data analysis is the data reduction. In this step raw neutron data, which exist in the time-of-flight (TOF) and the neutron count formats, are reduced to scattering rate and energy transfer formats using the instrument parameter files already stored in the Mantid application. In Mantid application data reduction dialogs are available in the Interface menu. For the data reduction in the indirect geometry QENS instruments, such as IRIS and OSIRIS, following steps are to be followed:
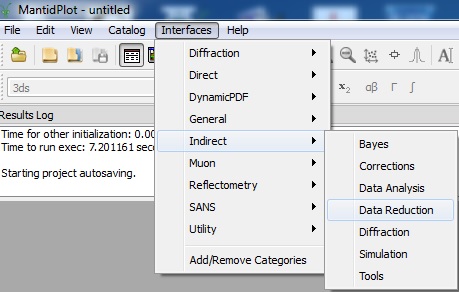
- Click on the Interface menu at the top of the Mantid application.
- Click on Indirect and then click on Data Reduction.
- In the energy transfer dialog select the instrument IRIS or OSIRIS.
- In the Analyser option select analyser, graphite or mica for IRIS and graphite for OSIRIS
- In the Reflection option select 002 or 004 depending on the analyser setting of your data
- In the Input Files option input run numbers in the field Run Files. To load a range of Raw files, give run numbers using a dash. To select some files within a range a combination of comma and dash can be used. To illustrate this an input 5400-5412 loads all raw files ends with run number 5400 to 5412. The input 5400-5405, 5410-5412 loads raw files 5400 to 5405 and 5410 to 5412, all inclusive.
- To sum raw files to produce a single reduced file, check on Sum Files option
- It is always good to check on Load Logs option, which loads information on temperatures etc., parameters stored in log file, however, this is optional.
- The option Use Calib File can be checked if calibration file is available.If a required calibration file is available in the workspace area as _calib that will be selected autometically when the Workspace is chosen. Otherwise, if File option is used, use the Browse option to load that file. This step is optional.
- Keep Mode option Individual if reduced spectrum are required for individual detectors or Q (momentum transfer) values.To integrate all Q-value information on a single reduced file, often required for elastic window scan, select All in the Mode option.To sum up a group of detectors use the Group option. In the Group option equal number of detectors are summed up for each group. If number of all detectors are not divisible by selected number of groups, the reminder of this division will be kept in a last extra group. To customise the number of detectors to be summed use Custom option. In this option one should use the following format: To add detectors 1-5 use dash, to use separate detectors use comma. As for example the input "1-5,8,9-15" will create three separate groups, first is the sum of 1-5 detectors, second will contain single detector 8 and the third will again sum of detectors 9-15. In the File option one can use a .map file for customised grouping. The detail specification of a map file will be found here.
- Keep all other options as default, which can be changed later for detailed analysis.
- Keep Output Options all default or can check on some additional options, such as ASCII to get ASCII output directly.
- Select plot option Spectrum or Contour for 1D or 2D plots or can keep None
- Click on Run
- The reduced file will appear in the LHS workspace pane in the Mantid application. A reduced file in the nexus or ASCII format as requested is saved in the Default Save Directory mentioned in Manage Directory section.
More on data reduction will be found
here. The theory behind data reduction will be found
here
Previous Page Next Page Content