SANS Group | SANS Instruments | SANS Team | Science | Sample Environment | Data Analysis
Install Mantid Workbench
Download from: https://download.mantidproject.org/
O. Arnold, et al., Mantid—Data analysis and visualization package for
neutron scattering and μSR experiments, Nuclear Instruments and Methods
in Physics Research Section A, 764 (2014) 156-166, http://dx.doi.org/10.1016/j.nima.2014.07.029
Part III:
Add runs
If you have scattering data from repeated measurements on the same sample (or can) you can add like runs together so that they appear to Mantid as if they were just one longer measurement. You might do this, for example, if you have measured a sample for few minutes but then find that statistics are not good, so you measure it again.
Open SANS Reduction Graphical User Interface (GUI), click on Sum Runs tab as in the picture below:
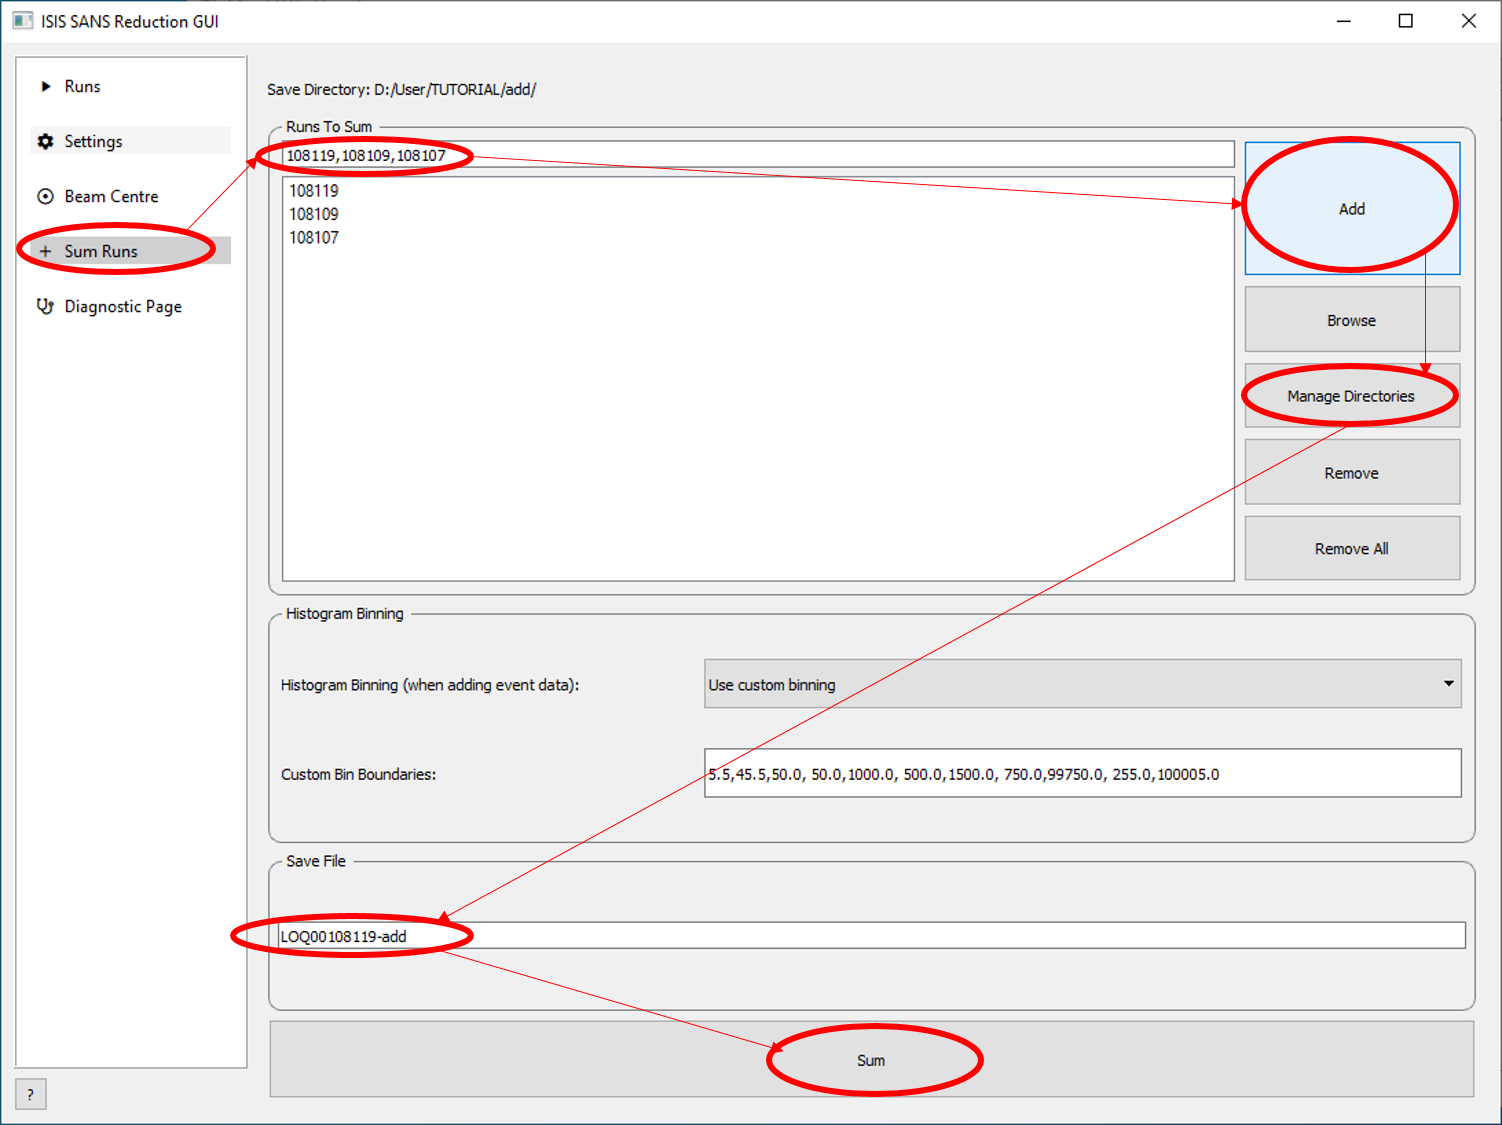
Type the numbers of the files in the field “Runs to Sum” separated only by comma, then press “Add”. The system finds the files and writes them down in the big box under the “Runs To Sum” field. Now, select the folder you want to save the added files in “Manage Directories”, choose a name in “Save File” (respect the format name*) and click “Sum”.
*The format name, default for all your data files, will have the name of the instrument, the first run number with few leading zeroes and the extension "-add", which for our example is LOQ00108119-add.
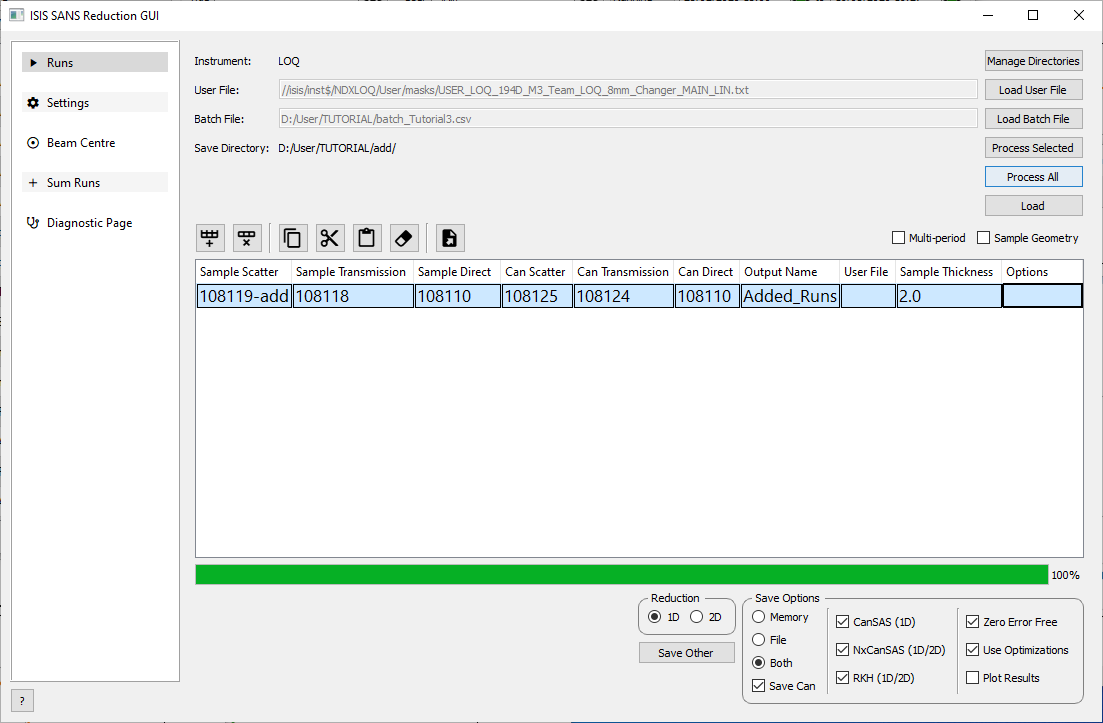
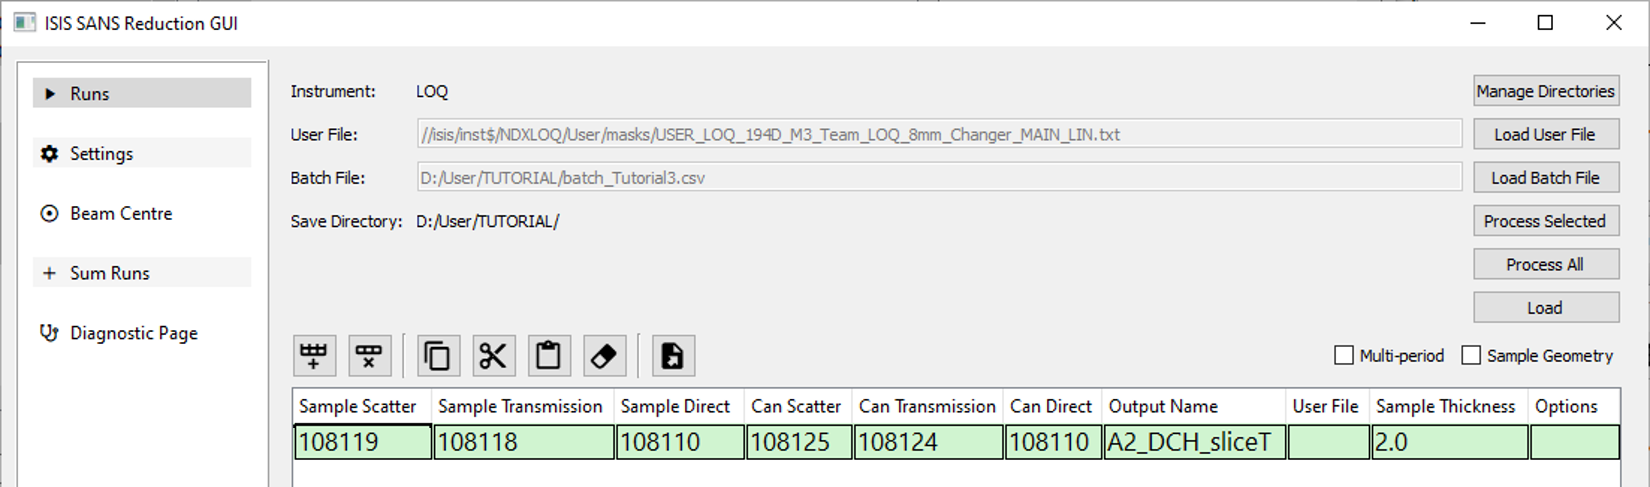
When adding files, you are in fact adding the raw data, so now you have to reduce the final added file: Open the tab “Runs” of SANS Reduction GUI, enter the name of the "–add" file as the “Sample Scatter” as in the picture above** and use the transmission from one of your added files (you don’t have to add the TRANS files). Check "Part I" to remember how to reduce data.
**Note that you dont need to write the name of the instrument and leading zeros, but only the run number and the extension "-add".
Use Event Mode (monitoring the experiment as a function of time)
If, for example, you are monitoring a phase transition of your sample, you could launch several short time measurements, but you can also choose to run a long measurement and afterwards slice it down in short periods of time. In the example below, we are slicing a long measurement of 3600s in three short periods of 1200s.
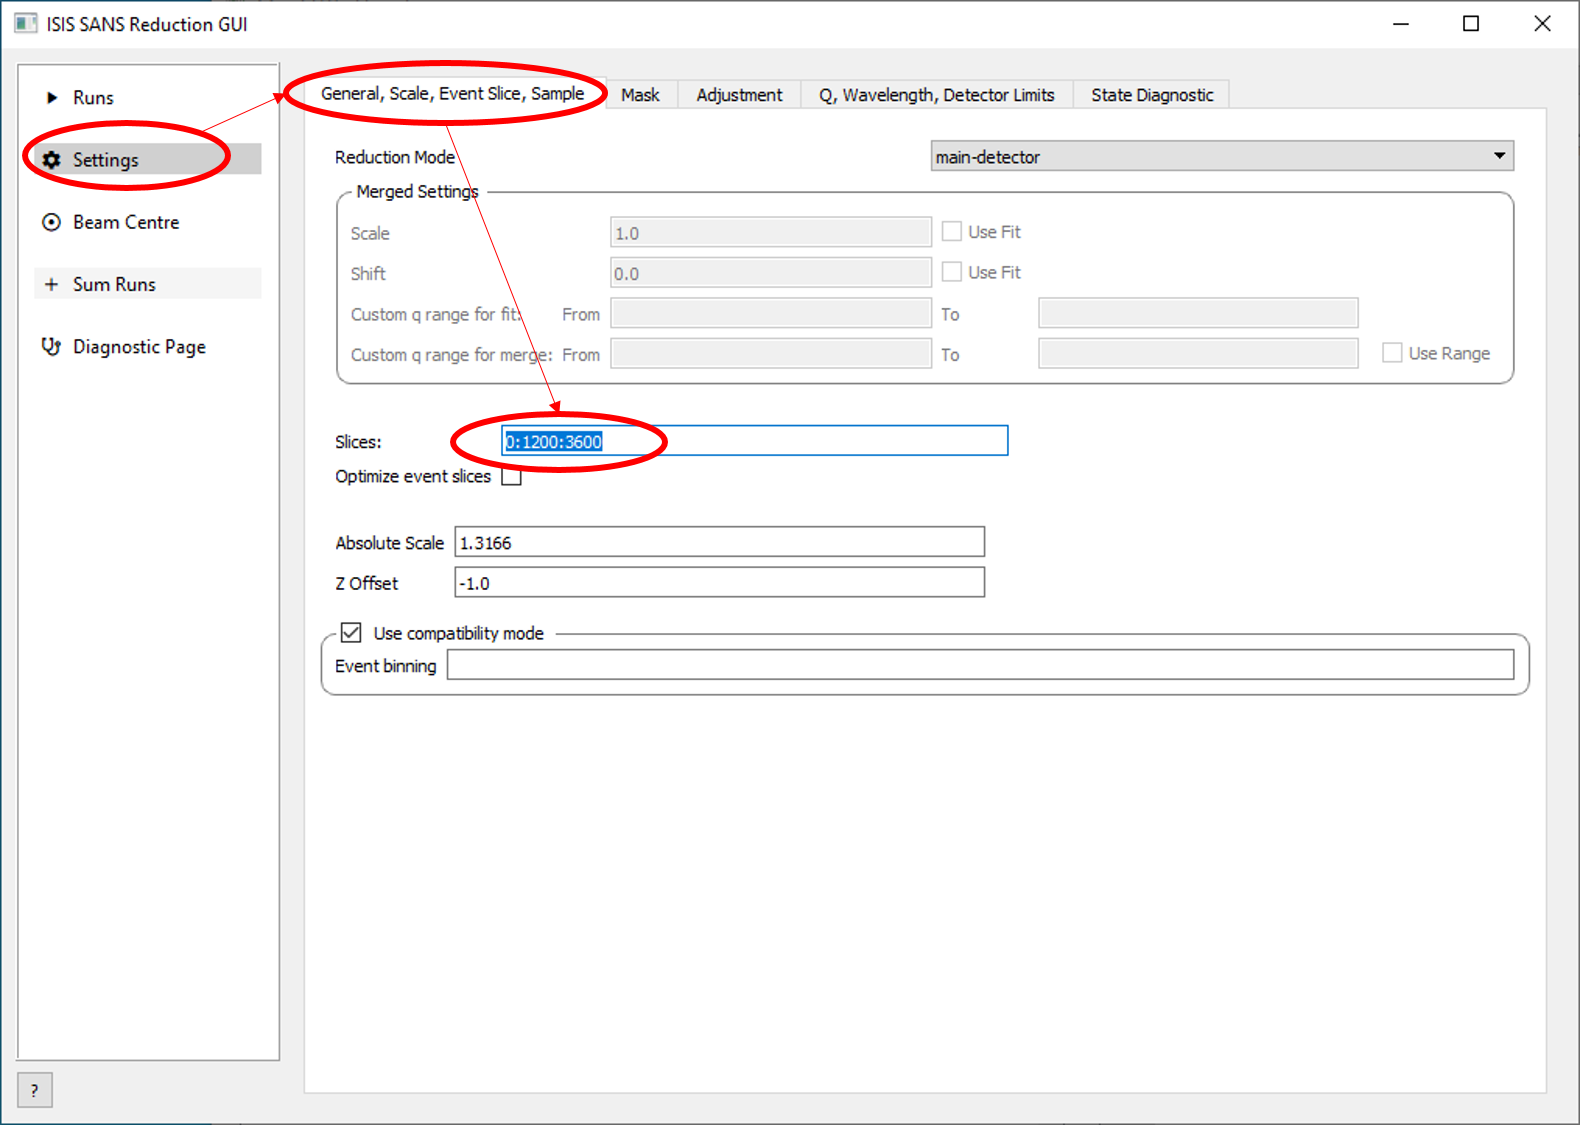
Open Mantid GUI and choose the tab “Settings > General Scale Event Slice”. In the field “Slices” type the time (in seconds) that you want to start:step:stop, exactly in this format, for example, 0:1200:3600, which means we will have three slices of 1200s each starting from the begining in this experiment that you ran for 3600s.
We could also start slicing from the middle to the end, for example writing 2400:200:3600, which means that we would slice only the last 20 min of the experiment (from 2400s to 3600s) in 6 short periods of 200s.
When using the event mode (or Event Slice), you are in fact slicing the raw data, so now you have to reduce the data: Open the tab “Runs” of Mantid GUI, choose an Output Name to remember that this is your sliced experiment, and reduce as usual. Check "Part I" to remember how to reduce data.
VERY IMPORTANT : After reducing data using Event Slice, go back to “Settings > General Scale Event Slice” and clean the field Slice, otherwise all your subsequent reducing data will be in slice mode !
Slice Wavelength Ranges
When you are using a Time of Flight (TOF) instrument, you have a range of wavelenghts hiting your sample. For example, here in this example at LOQ beamline, we are using a range from 2Å to 10Å. If you want to monitor the influence of the wavelength on your sample, you can use Slice Wavelength Ranges tool to slice the data after the measurement.
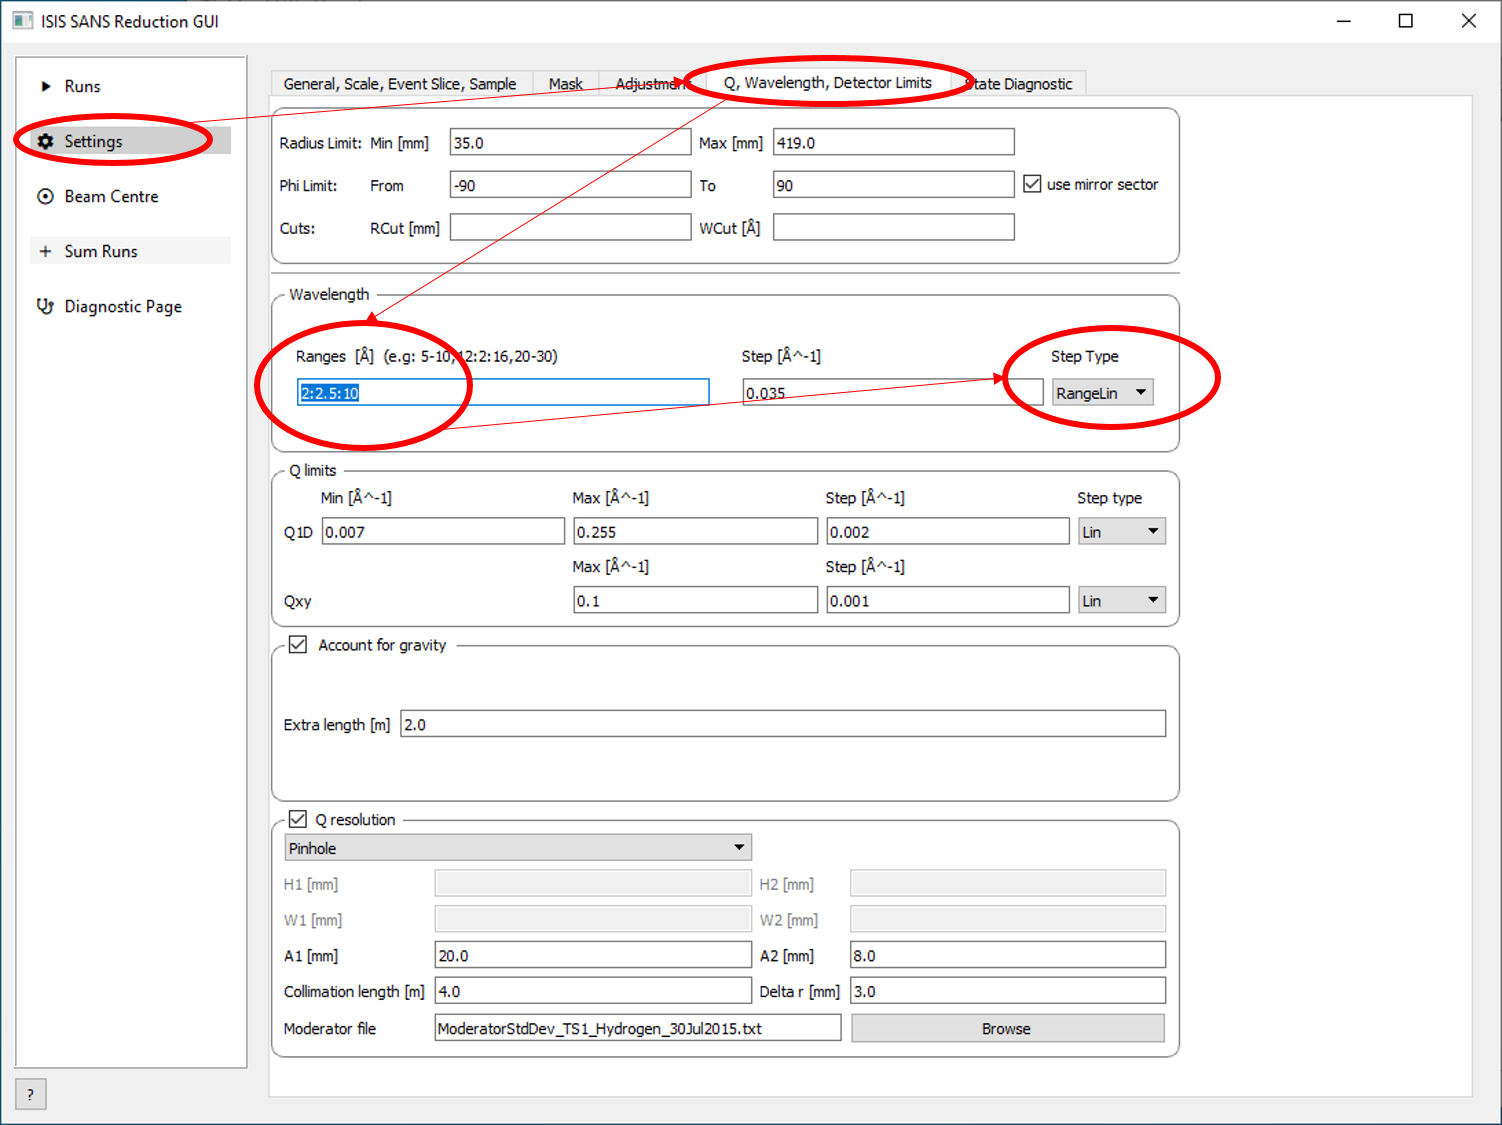
Open Mantid GUI and choose the tab “Settings > Q, Wavelength, Det Limits”. In the field “Wavelength > Ranges” type the range (in Å) that you wish to start:step:stop,
exactly in this format, for example, 2:2.5:10, which means we will
have four short ranges of 2.5 Å each instead of the original range from 2Å to 10Å.
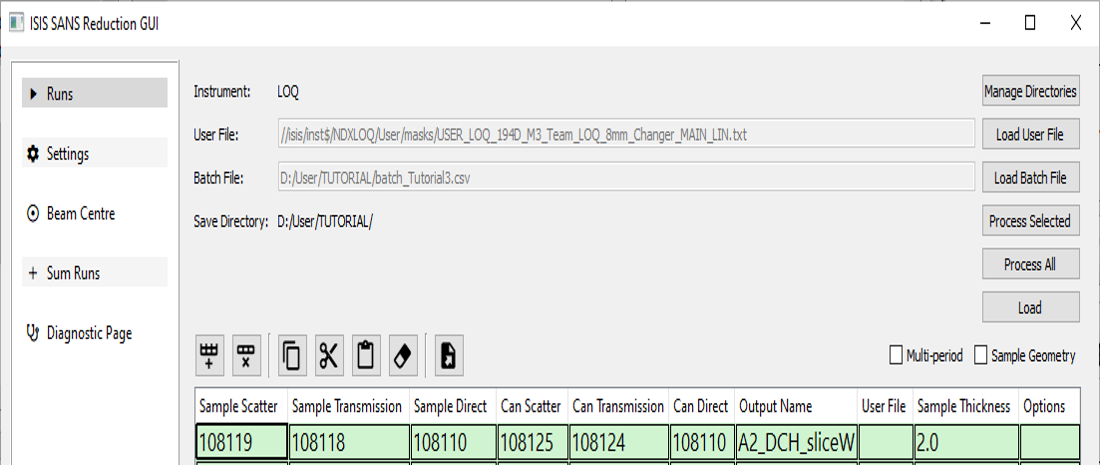
When using the Wavelength Slice mode, you are in fact slicing the raw data, so now you have to reduce the data: Open the tab “Runs” of Mantid GUI, choose an Output Name to remember that this is your sliced experiment, and reduce as usual. Check "Part I" to remember how to reduce data.
VERY IMPORTANT : After reducing data using Wavelength Slice, go back to “Settings > Q, Wavelength, Det Limits” and clean the field Wavelength > Ranges, otherwise all your subsequent reducing data will be in slice mode !
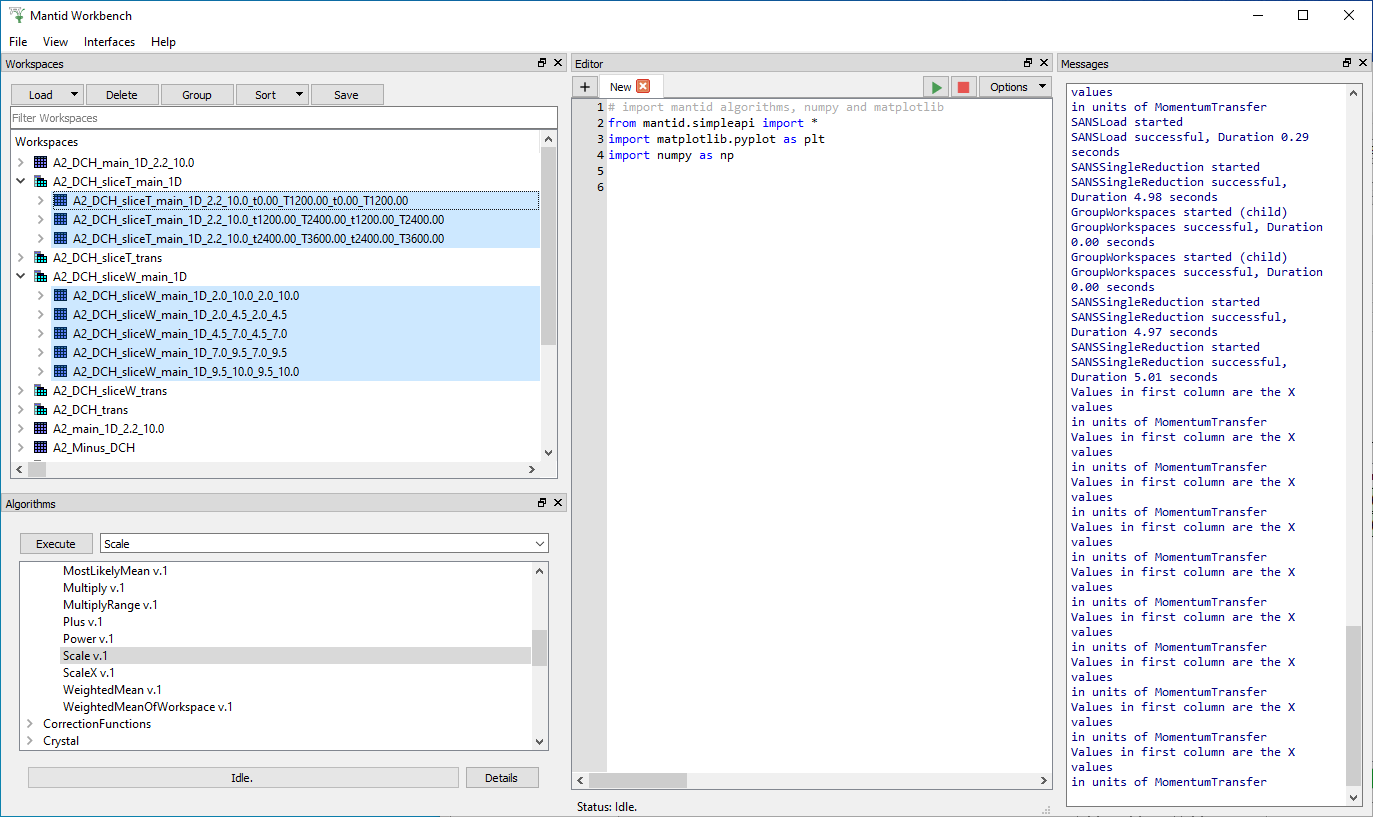
You can now minimize the GUI window and continue to monitor the
reducing process through the main window of MANTID WORKBENTCH, as you have learned in "Part I". The reduced data is collected in the WORKSPACE WINDOW, as we can see in the picture above. The file will have the name you gave in the GUI, followed by an extension indicating the range of Time or Wavelength as you chose.
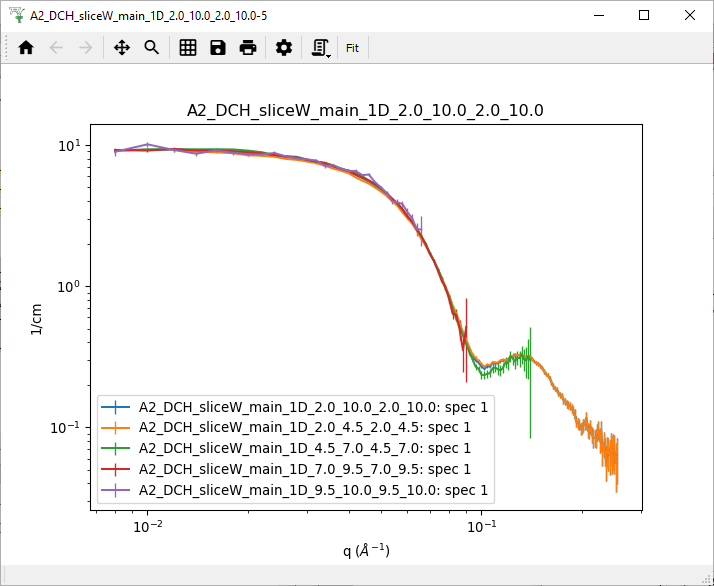
The picture above shows the original Range in Wavelength of your experiment, the BLUE curve (from 2Å to 10Å, in our example), compared to the short ranges as you chose to slice. As you see in the graph, the first range, lower wavelengths, from 2Å to 4.5Å, the ORANGE curve, affects more the long Q range. And the last range, from 9.5Å to 10Å, the VIOLET curve, affects more the low Q range. In this example, all the wavelengths are superimposed without distortions, which means, the scattering of this sample is not influenced by the Wavelength of the neutron beam at these ranges. However, as we see in the graph below, these ranges are not always all superimposed.
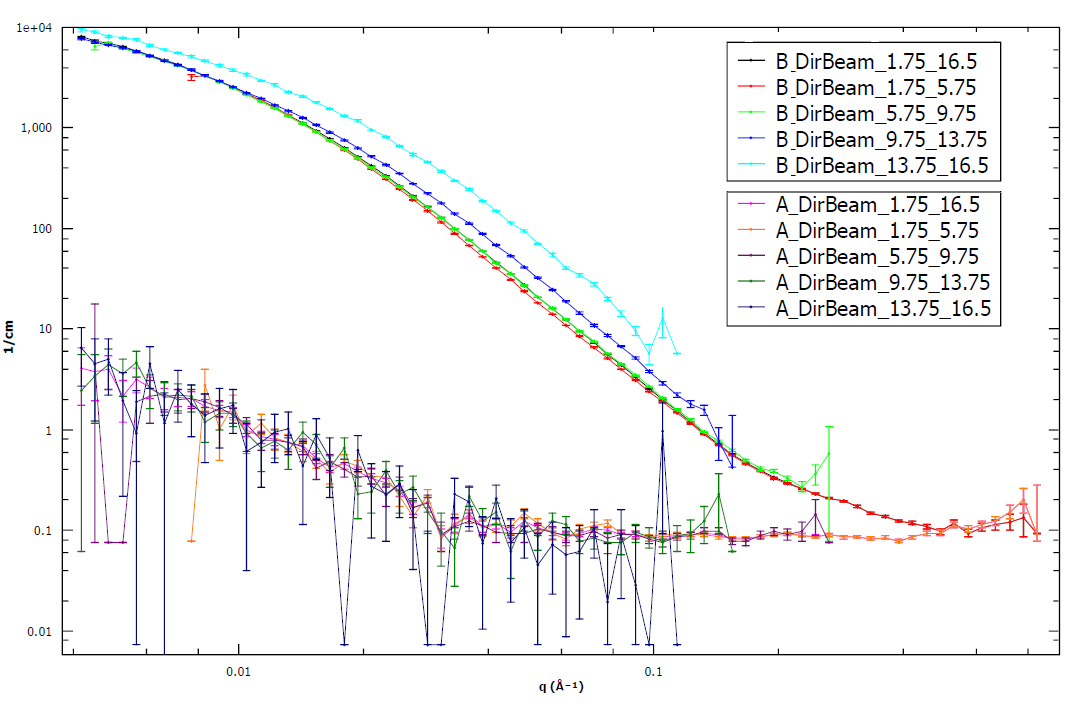
As we see in the example above, the curves DARK BLUE and CYAN for samples "B", are not superimposed to the rest of the wavelength ranges. Since
these samples "B" present a very intense scattering, this mismatch might
be due to multiple scattering phenomena. You can see that in the same graph, samples "A", presenting a lower scattering intensity, have a good superposition for all wavelength ranges.
In this case, we can decided to cut
off the wavelength ranges that are in mismatch, which means above 9Å, or above that DARK BLUE curve, for this example.
This is the end of Part III, it continues in Part IV…
...