SANS Group | SANS Instruments | SANS Team | Science | Sample Environment | Data Analysis
File types
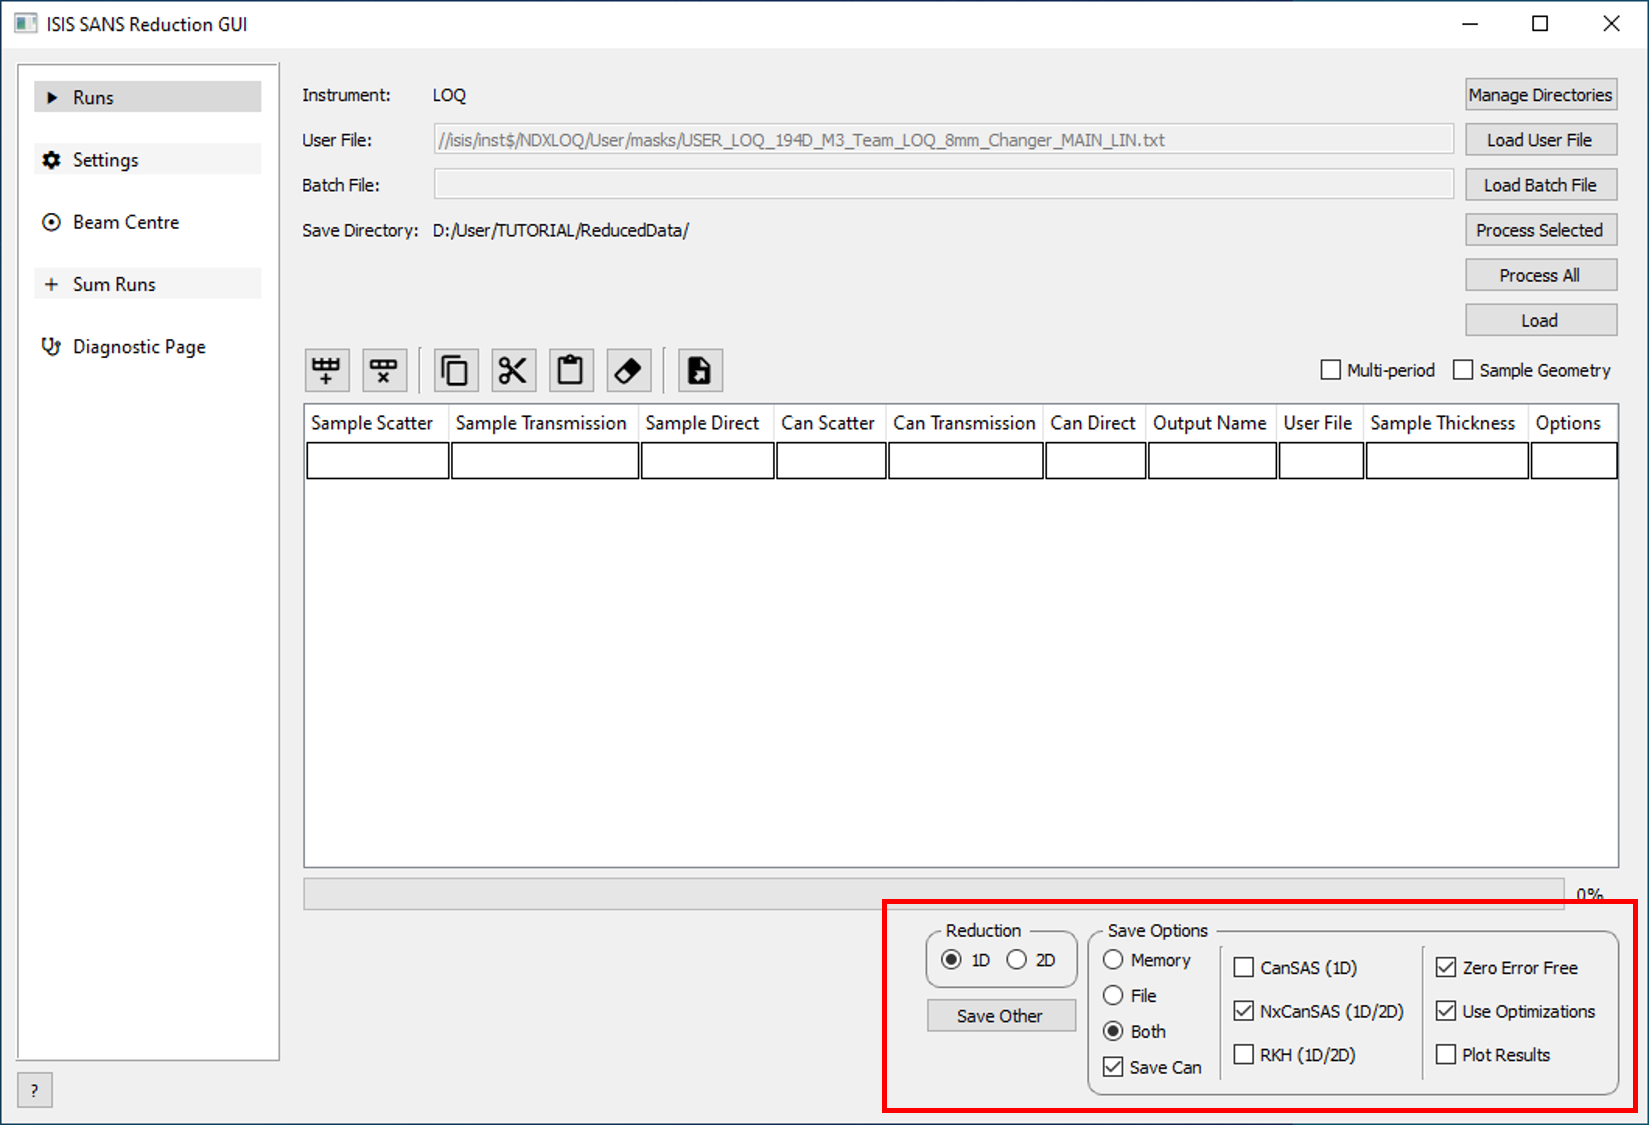
The SANS Reduction GUI offers a
choice of three different file output formats of differing complexity, but of
therefore differing capability. For 1D (q vs Intensity) data you can write your
data in all three formats, if you wish. For 2D data (qx vs qy vs Intensity) we
recommend you use the NxCanSAS format, particularly if you plan to make use of
SasView for your data analysis.
RKH Format
Can be used to store 1D or 2D
reduced data.
WARNING: THIS FILE FORMAT IS
DEPRECATED AND WILL BE DISCONTINUED IN FUTURE VERSIONS OF MANTID.
This is the historic ISIS SANS
reduced data format. It is a simple ASCII-encoded text file (meaning it is
‘human-readable’) containing minimal metadata. The structure of a RKH
format file for 1D (q vs Intensity) data looks like this:
LOQ Fri 19-JUN-2020 18:23 Workspace: A2_SANS/TRANS 124 0 0 0 1 124 0 0 0 0 03 (F12.5,2E16.6) 0.00800 9.166510e+00 1.403222e-01 1.419081e-03 0.01000 9.242677e+00 9.854625e-02 1.519441e-03 0.01200 9.308708e+00 7.764759e-02 1.657552e-03 0.01400 9.151157e+00 6.430589e-02 1.772521e-03 0.01600 9.168767e+00 5.700027e-02 1.877077e-03 0.01800 9.019829e+00 5.104391e-02 1.965153e-03
It starts with 4 lines of
metadata telling you when this file was created (not when the data was
collected), the title assigned to the original raw data, and how many lines of
datapoints there are in the file (124 in this case and rows 1 to 124 are
present). The zeroes, and how they are spaced, is important, so do not change
them! The fifth line is a Fortran format specifier statement describing
how the data values have been formatted. If you don’t know Fortran, do not
worry!
The four columns are: q,
Intensity, the uncertainty on the Intensity, and the uncertainty on q. No other
information, such as sample/can transmissions, or any processing history, is
stored in this format.
The 2D version of this format is
a little more complex but is described here: https://www.isis.stfc.ac.uk/Pages/colette-ascii-file-format-descriptions.pdf
CanSAS Format
Can be used to store 1D reduced
data only.
THIS IS THE FORMAT THAT WE
RECOMMEND YOU USE TO STORE YOUR 1D DATA.
This format was introduced in
2007 as a result of the efforts of an inter-Facility Working Group under the
auspices of canSAS (www.cansas.org) as a
global standard for 1D reduced SAS data. It is flexible enough to permit the
inclusion of much more metadata (something increasingly important with the push
towards ‘Open Data’, data repositories, and data validation) whilst remaining
‘human-readable’. This is accomplished by structuring the file with eXtended
Markup Language (XML). In the same way that HTML describes how a webpage should
appear, XML describes how the data should be represented.
The structure of a CanSAS format
file for 1D (q vs Intensity) data looks like this:
<?xml version="1.0"?><?xml-stylesheet type="text/xsl" href="cansas1d.xsl" ?><SASroot version="1.1" xmlns="urn:cansas1d:1.1" xmlns:xsi="http://www.w3.org/2001/XMLSchema-instance" xsi:schemaLocation="urn:cansas1d:1.1 http://www.cansas.org/formats1.1cansas1d.xsd" > <SASentry name=""> <Title>A2_SANS/TRANS</Title> <Run>108119</Run> <SASdata> <Idata><Q unit="1/A">0.008</Q><I unit="1/cm">9.16651</I><Idev unit="1/cm">0.140322</Idev><Qdev unit="1/A">0.00141908</Qdev></Idata> <Idata><Q unit="1/A">0.01</Q><I unit="1/cm">9.24268</I><Idev unit="1/cm">0.0985462</Idev><Qdev unit="1/A">0.00151944</Qdev></Idata> <Idata><Q unit="1/A">0.012</Q><I unit="1/cm">9.30871</I><Idev unit="1/cm">0.0776476</Idev><Qdev unit="1/A">0.00165755</Qdev></Idata> <Idata><Q unit="1/A">0.014</Q><I unit="1/cm">9.15116</I><Idev unit="1/cm">0.0643059</Idev><Qdev unit="1/A">0.00177252</Qdev></Idata> <Idata><Q unit="1/A">0.016</Q><I unit="1/cm">9.16877</I><Idev unit="1/cm">0.0570003</Idev><Qdev unit="1/A">0.00187708</Qdev></Idata> <Idata><Q unit="1/A">0.018</Q><I unit="1/cm">9.01983</I><Idev unit="1/cm">0.0510439</Idev><Qdev unit="1/A">0.00196515</Qdev></Idata>… </SASdata> <SAStransmission_spectrum name="sample"> <Tdata><Lambda unit="A">2.2385</Lambda><T unit="none">0.82319</T><Tdev unit="none">0.0122611</Tdev></Tdata> <Tdata><Lambda unit="A">2.31685</Lambda><T unit="none">0.807274</T><Tdev unit="none">0.0112535</Tdev></Tdata> <Tdata><Lambda unit="A">2.39794</Lambda><T unit="none">0.820304</T><Tdev unit="none">0.0108516</Tdev></Tdata>… </SAStransmission_spectrum> <SAStransmission_spectrum name="can"> <Tdata><Lambda unit="A">2.2385</Lambda><T unit="none">0.845674</T><Tdev unit="none">0.0125657</Tdev></Tdata> <Tdata><Lambda unit="A">2.31685</Lambda><T unit="none">0.822937</T><Tdev unit="none">0.0114248</Tdev></Tdata> <Tdata><Lambda unit="A">2.39794</Lambda><T unit="none">0.835294</T><Tdev unit="none">0.011011</Tdev></Tdata> … </SAStransmission_spectrum> <SASsample> <ID>A2_SANS/TRANS</ID> </SASsample> <SASinstrument> <name>LOQ</name> <SASsource> <radiation>Spallation Neutron Source</radiation> </SASsource> <SAScollimation/> <SASdetector> <name/> </SASdetector> </SASinstrument> <SASprocess> <name>Mantid generated CanSAS1D XML</name> <date>19-Jun-2020 18:23:27</date> <term name="svn">5.0.0</term> <term name="user_file"> USER_LOQ_194D_M3_Team_LOQ_8mm_Changer_MAIN_LIN</term> <term name="sample_trans_run">108118</term> <term name="sample_direct_run">108110</term> <term name="can_trans_run">108124</term> <term name="can_scatter_run">108125</term> <term name="can_direct_run">108110</term> <SASprocessnote/> </SASprocess> <SASnote> </SASnote> </SASentry></SASroot>
The first 7 lines are simply
part of the XML declaration. They tell any XML-compliant program where it can
find the information it needs to display the data (a file called cansas1d.xsl,
the ‘stylesheet’), and how it can verify that the data is properly formatted
(the file cansas1d.xsd, the ‘schema’). If the program is not XML-compliant then
the data just appears like you see it above. Programs that are
XML-compliant include all web browsers and, for example, Microsoft Excel.
In the early part of the file
you can see exactly the same data that was in the earlier RKH format file, it is
just ‘wrapped’ in XML tags that not only describe what the values are, but what
their units are also. Then, as the file progresses, you can see that it
also contains the wavelength vs transmission data for the sample (complete with
the uncertainty on the transmission), the wavelength vs transmission data for
the can, and then a metadata block which not only tells you which version of
Mantid produced the file, but where, the user file used to conduct the
reduction, and the run numbers that were processed.
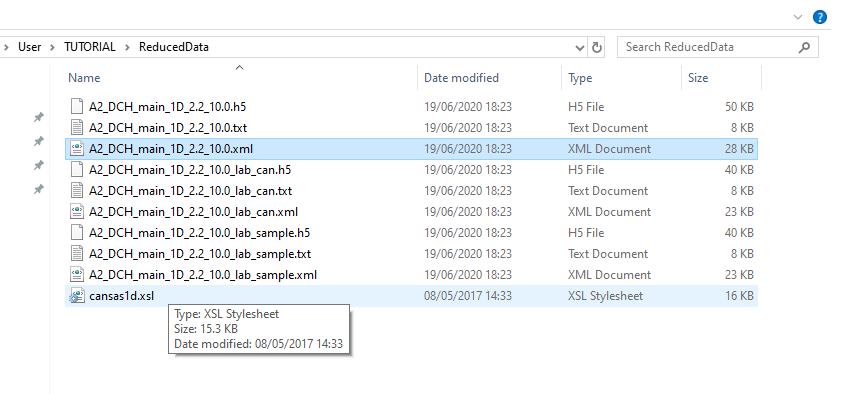
You can download the ".xsl" file from here cansas1d.xsl and make sure you save it in the same folder of your ".xml" file.
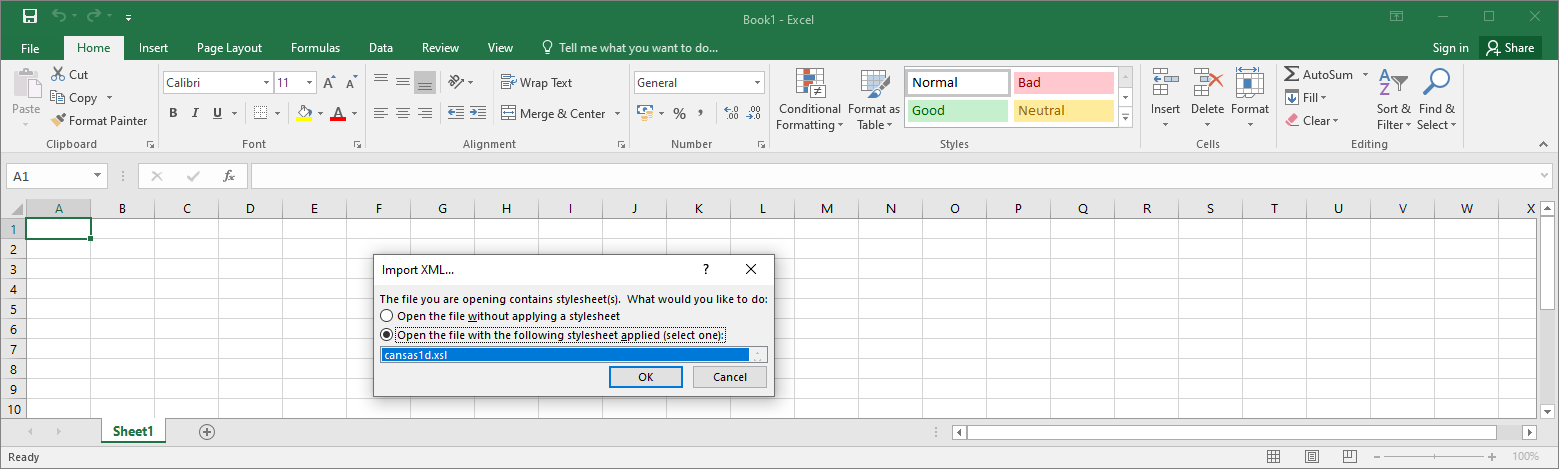
Then go to Excell > File > Open > file.xml
When asked, chose the option "Open the file with the following stylesheet applied (select one): cansas1d.xsl " as in the picture below:
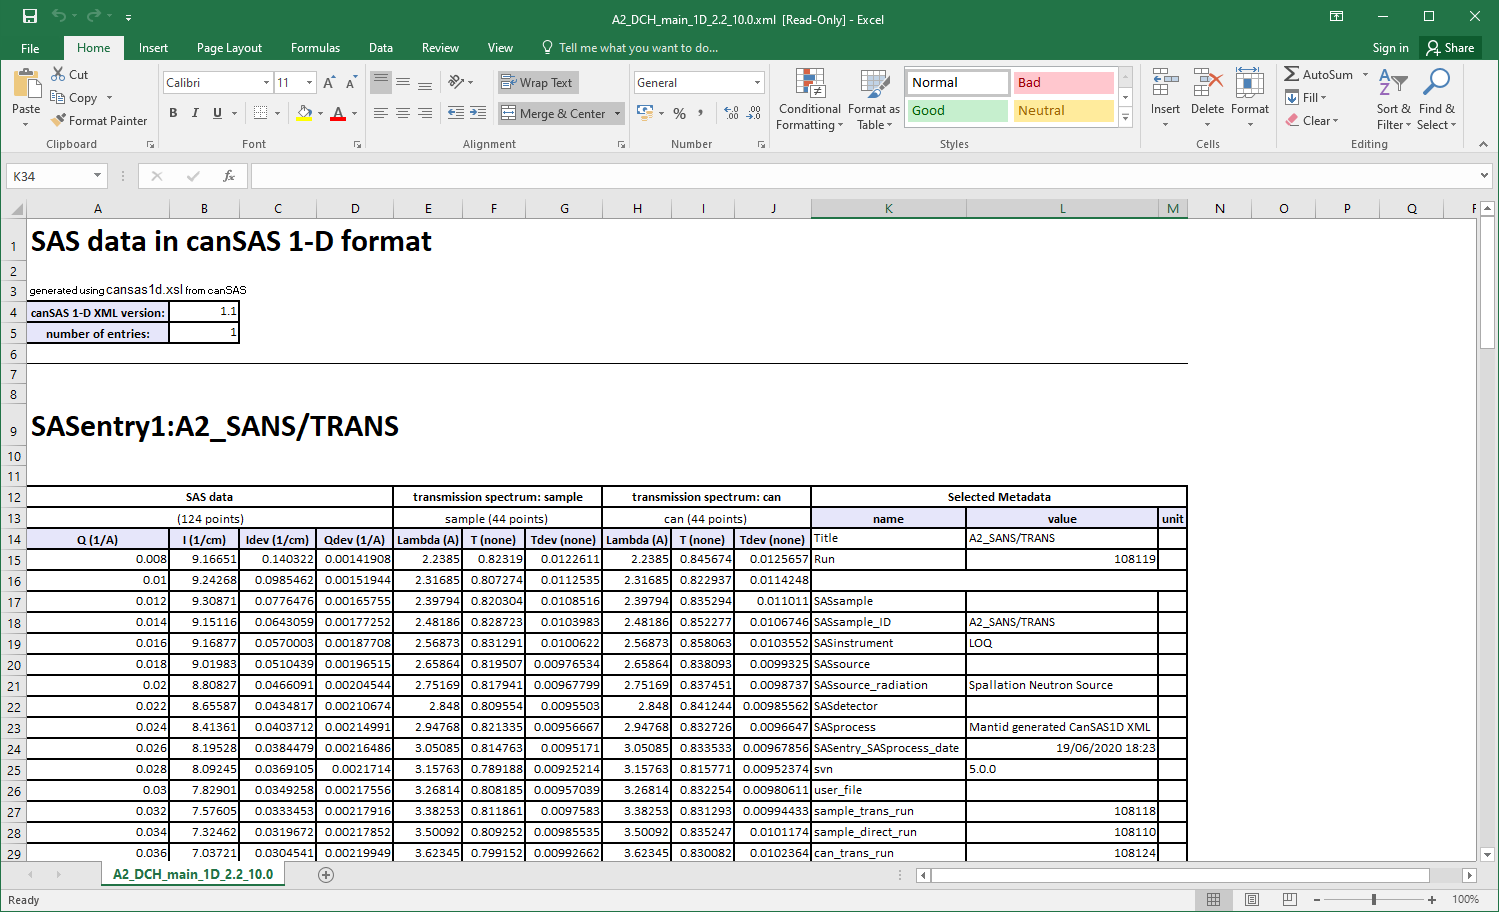
Here below, you can see how the stylesheet has taken the linear structure of the input XML
file and presented it in a logical and readable manner within the Excel worksheet.
NxCanSAS Format
Can be used to store 1D or 2D
reduced data at present.
THIS IS THE FORMAT THAT WE
RECOMMEND YOU USE TO STORE YOUR 2D DATA.
This format was devised in 2012
as a result of the efforts of an inter-Facility Working Group under the
auspices of canSAS (www.cansas.org) as a
global standard for multi-dimensional (or nD) reduced SAS data. It is flexible
enough to permit the inclusion of considerable amounts of metadata (something
increasingly important with the push towards ‘Open Data’, data repositories,
and data validation) and even ancillary data from, for example, measurements
performed simultaneously with the collection of the SAS data.
The NxCanSAS format is an
approved ‘application definition’ for reduced data only within the
HDF5-compliant (HDF stands for Hierarchical Data Format) NeXus format (https://www.nexusformat.org/). As this format is designed to handle much larger
volumes of reduced data it is not a text format like the RKH format or the
CanSAS format; instead the data is stored in binary form for efficiency and
speed. This means that NxCanSAS files are not ‘human-readable’. If you
want to examine the contents of an NxCanSAS (or indeed any HDF file) we
recommend you install the program HDFView from https://www.hdfgroup.org/.
...